商业地产坪效分析-基于租售均衡假设

[1] 分析框架
假设基于加权平均租售坪效贡献率是均衡的,简称租售均衡假设,就是租金总能匹配销售,商铺在出租给商户能被有效持续的经营,我们称为铺面被有效配置,获得被当前市场定价的即合理的租金乘以租金倍数的销售,即购物中心铺面价值的源泉,且租售总是能理想的实现动态均衡,此假设正是以下探讨的租售贡献率与租售比线性方程的假设,即租售二元模型。
第二版分析框架,在进一步深入理解业务数据,掌握新的分析方法,开发出算法后形成的分析框架,细节上有更多的细化和更新。
全文两万五千字,2023年8月更新细节。所运营之商场均采用租售均衡作坪效分析
[2]为什么要用权重算法
一直以来有一个困扰,一组数据用均值(或者中值或众数)代表整体水平是否可靠?如图展示一个例子,直观说明算术平均(均值)是一个平庸的指标。算术平均值不受整体离散程度的影响,只和汇总数和数据个数有关,而加权平均数据越离散值越大,体现离散差异,权重越大代表贡献率就大,能反映由权重支配的整体数据。
\frac{a}{b} 的算术平均是一个平庸的指标,与数据的离散程度无关,不能代表 \frac{a}{b} 的整体水平,始终等于1.667。而 \frac{a}{b}\times{\frac{a}{50}} 权重法比均值更好的反映离散差异,能代表 \frac{a}{b} 的整体水平。


[3] 算法公式和模型
销售坪效sale efficiency = \frac{sale}{area} ;
sale / area as sale_ping,租金坪效rent efficiency =\frac{rent}{area} ;
rent / area as rent_ping,租售比rent&sale ratio = \frac{rent}{sale} ;
rent / sale as ratio,整体销售total sale = \sum_{j=1}^{m}\sum_{i=1}^{n}{{sale_{ji}}} , m 个月里 n 个商户的销售汇总;
sum(sale) as s_m_sale, 整体租金total rents = \sum_{j=1}^{m}\sum_{i=1}^{n}{{rent_{ji}}} , m 个月里 n 个商户的租金汇总;
sum(rent) as s_m_rent,商户销售加权坪效
weighted sale efficiency = \frac{{sale}}{{area}}\times{}\frac{{sale}}{{totalSale}} =\frac{{sale}}{{area}}\times{}\frac{{sale}}{{\sum_{j=1}^{m}\sum_{i=1}^{n}{{sale_{ji}}}}} ;
(sale / area) * (sale / s_m_sale) as weighted_sale_ping,商户租金加权坪效
weighted rent efficiency = \frac{{rent}}{{area}}\times\frac{{rent}}{{totalRent}}= \frac{{rent}}{{area}}\times{}\frac{{rent}}{{\sum_{j=1}^{m}\sum_{i=1}^{n}{{rent_{ji}}}}};
(rent / area) * (rent / s_m_rent) as weighted_rent_ping,分类销售加权坪效
multi-field categorical weighted sale efficiency = \sum_{k=1}^{c}\sum_{j=1}^{m}\sum_{i=1}^{n}\frac{{sale_{kji}}}{{area_{i}}}\times{}\frac{{sale_{kji}}}{{totalSale}} =\sum_{k=1}^{c}\sum_{j=1}^{m}\sum_{i=1}^{n}\frac{{sale_{kji}}}{{area_{i}}}\times{}\frac{{sale_{kji}}}{{\sum_{j=1}^{m}\sum_{i=1}^{n}{{sale_{ji}}}}} ;
sum((sale / area) * (sale / s_sale)) as category_weighted_sale_ping,
-- sql不允许sum((sale / area) * (sale / sum(sale)))嵌套聚合函数,必要做表的拼接
分类租金加权平均坪效
multi-field categorical weighted rent efficiency = \sum_{k=1}^{c}\sum_{j=1}^{m}\sum_{i=1}^{n}\frac{{rent_{kji}}}{{area_{i}}}\times\frac{{rent_{kji}}}{{totalRent}}= \sum_{k=1}^{c}\sum_{j=1}^{m}\sum_{i=1}^{n}\frac{{rent_{kji}}}{{area_{i}}}\times{}\frac{{rent_{kji}}}{{\sum_{j=1}^{m}\sum_{i=1}^{n}{{rent_{ji}}}}};
sum((rent / area) * (rent / s_rent)) as category_weighted_rent_ping,整体销售加权平均坪效
whole weighted average sale efficiency =\sum_{j=1}^{m}\sum_{i=1}^{n}(\frac{{sale_{ji}}}{{area_{i}}}\times{}\frac{{sale_{ji}}}{{\sum_{j=1}^{m}\sum_{i=1}^{n}{{sale_{ji}}}}}) , sale_{ji} :j 月商户 i 的销售, {area_i} :商户 i 租赁的商铺面积, m : 月数, n : j 月商户数;
sum((sale / area) * (sale / s_m_sale)) as a_weighted_sale_ping,整体租金加权平均坪效
whole weighted average rent efficiency =\sum_{j=1}^{m}\sum_{i=1}^{n}(\frac{{rent_{ji}}}{{area_{i}}}\times{}\frac{{rent_{ji}}}{{\sum_{j=1}^{m}\sum_{i=1}^{n}{{rent_{ji}}}}}) , rent_{ji} :j 月商户 i 的租金, {area_i} :商户 i 租赁的商铺面积, m : 月数, n : j 月商户数;
sum((rent / area) * (rent / s_m_rent)) as a_weighted_rent_ping,销售加权贡献率
weighted sale contribution ratio = \frac{weightedSalePing}{wholeWeightedAverageSalePing} = \frac{\frac{{sale}}{{area}}\times{}\frac{{sale}}{{\sum_{j=1}^{m}\sum_{i=1}^{n}{{sale_{ji}}}}}}{\sum_{j=1}^{m}\sum_{i=1}^{n}(\frac{{sale_{ji}}}{{area_{i}}}\times{}\frac{{sale_{ji}}}{{\sum_{j=1}^{m}\sum_{i=1}^{n}{{sale_{ji}}}}})} ;
((sale / area) * (sale / s_m_sale)) / a_weighted_sale_ping as weighted_sale_contribution_ratio,租金加权贡献率
weighted rent contribution ratio =
\frac{weightedRentPing}{wholeWeightedAverageRentPing} = \frac{\frac{{rent}}{{area}}\times{}\frac{{rent}}{{\sum_{j=1}^{m}\sum_{i=1}^{n}{{rent_{ji}}}}}}{\sum_{j=1}^{m}\sum_{i=1}^{n}(\frac{{rent_{ji}}}{{area_{i}}}\times{}\frac{{rent_{ji}}}{{\sum_{j=1}^{m}\sum_{i=1}^{n}{{rent_{ji}}}}})} ;
((rent / area) * (rent / s_m_rent)) / a_weighted_rent_ping as weighted_rent_contribution_ratio,销售贡献率汇总
whole multi-field categorical sale contribution ratio = \sum_{k=0}^{c-1}\sum_{j=1}^{m}\sum_{i=1}^{n}{weightedSaleContributionRatio{_{kji}}} ;
sum(weighted_sale_contribution_ratio) as whole_weighted_sale_contribution_ratio,租金贡献率汇总
whole multi-field categorical rent contribution ratio = \sum_{k=0}^{c-1}\sum_{j=1}^{m}\sum_{i=1}^{n}{weightedRentContributionRatio{_{kji}}} ,c-1个分类分组下的贡献率汇总,合计为分类数量或者几个分类数的乘积,表示不分类或以某个类或者多重类下m个月里n个商户的销售贡献率分类汇总,比如以月分类汇总历月贡献率,以年分类汇总历年度贡献率;
sum(weighted_rent_contribution_ratio) as whole_weighted_rent_contribution_ratio,多重分类销售贡献率
multi-field categorical sale contribution ratio = \sum_{k=1}^{c}\sum_{j=1}^{m}\sum_{i=1}^{n}\frac{weightedSaleContributionRatio_{kji}}{wholeMultifieldCategoricalSaleContributionRatio} ,就是n个分类(分组)的贡献率除以n - 1(分组)分类的贡献率,依然还是贡献率。
sum(weighted_sale_contribution_ratio) / whole_weighted_sale_contribution_ratio as sale_contribution_ratio,多重分类租金贡献率
multi-field categorical rent contribution ratio = \sum_{k=1}^{c}\sum_{j=1}^{m}\sum_{i=1}^{n}\frac{weightedRentContributionRatio_{kji}}{wholeMultifieldCategoricalRentContributionRatio} ,分类数比汇总分类多1层;
sum(weighted_rent_contribution_ratio / whole_weighted_rent_contribution_ratio) as rent_contribution_ratio,多重分类权重租售比
multi-field categorical weighted average rent&sale ratio = \sum_{k=1}^{c}\sum_{j=1}^{m}\sum_{i=1}^{n}(ratio_{kji}\times{}\frac{{rent_{kji}}}{{\sum_{k=1}^{c}\sum_{j=1}^{m}\sum_{i=1}^{n}{{rent_{kji}}}}}) = \sum_{k=1}^{c}\sum_{j=1}^{m}\sum_{i=1}^{n}(\frac{{rent_{kji}}}{{sale_{kji}}}\times{}\frac{{rent_{kji}}}{{\sum_{k=1}^{c}\sum_{j=1}^{m}\sum_{i=1}^{n}{{rent_{kji}}}}}) , rent_{kji} :k 分类下 j 月 i 商户的租金。sale_{kji} :k 分类下j 月 i 商户的销售。 c 分类数量。e.g比如按年1个分类的租售比,按年业态2个分类的租售比,按年业态楼层计租方式4个分类的租售比;
sum(ratio * rent / s_rent) as category_weighted_ratio,坪效租售比
multi-field categorical weighted efficiency ratio = \frac{multifieldCategoricalWeightedRentPing}{multifieldCategoricalWeightedSalePing} ;
sum((rent / area) * (rent / s_rent)) / sum((sale / area) * (sale / s_sale)) as ping_ratio,盈亏平衡点 break even point
= saleContributionRatio - \frac{rent}{sale} \times{rentContributionRatio} ;
sale_contribution_ratio - (rent / sale) * rent_contribution_ratio as '盈亏平衡点', -- as break_even_point赚钱指数 money index
= breakEvenPoint * point
(sale_contribution_ratio - (rent / sale) * rent_contribution_ratio) * 10000 as money_index, -- as '赚钱指数', 基准销售即触发扣点租金的阈值销售S_{c}=\frac{R_{c}}{p}, \frac{1}{p} 就是租金倍数。设销售 S ,固定租金 R_{c} ,扣点 p 为合同约定的租金扣点,浮点租金R_{f}=S\times{p}
if(fixed > 0 and floating > 0,sale * fixed / floating / 10000,null) as '基准销售[万]',[4]贡献率和租售比线性方程
设销售贡献率y、租金贡献率x和赚钱指数i,赚钱指数i是租售比b和两贡献率x和y与常数C的线性关系:
i = (y - b * x) * C ,盈亏平衡点c = \frac{i}{C} 。
y = b \times x + c ,得 y 和 x是以 c 为截距,租售比 b 为斜率的一元线性方程,类似资本资产定价模型CAPM。 当不亏不盈时, c = 0,得 y = b \times x ,可推导租金倍数。
销售和租金呈现增长态势,理想的走势应该是租售曲线完全重合,称租售均衡。销售在2020年增长态势被打断,受制于口罩限流,2021年出现一波消费反弹。而租金的走势长期到达一定高度后,或将趋于稳定。c在2020年2月和3月为负值,b及商户亏损率处于历史性高峰,各购物中心纷纷降租减租与租户共渡难关,可以说减租幅度是史无前例的。理想的销售贡献率走势与租金贡献率持平,略往上方,走下方偏离幅度 \frac{y}{b\times x} - 1 >= 0 。如果半年以上销售贡献率大幅跌落到租金贡献率的下方,反映微观层面租户亏钱退租退场,中观层面购物中心倒闭,宏观商业环境大萧条。


[5]租金倍数
继续讨论贡献率和租售比线性关系,当不亏不盈时,盈亏平衡点 c = 0,得保底销售贡献率y = b \times x,得:
\frac{weightedSalePing}{wholeWeightedAverageSalePing} =\frac{rent}{sale}\times \frac{weightedRentPing}{wholeWeightedAverageRentPing};
设商户月销售 s,租金 r ,租赁面积a,月所有商户销售总额 S,租金总额 R,整体加权月销售坪效P_s,整体月加权租金坪效P_r,上式为:
\frac{s^{2}}{a\times{S\times{P_s}}} =\frac{r}{s}\times \frac{r^2}{a\times{R\times{P_r}}} ,
s^{3} =r^3\times{\frac{S\times{P_s}}{R\times{P_r}}} ,
s =r\times{\sqrt[3]{\frac{S\times{P_s}}{R\times{P_r}}}} ,
设租金倍数C_p =\sqrt[3]{\frac{S\times{P_s}}{R\times{P_r}}} ,
得不盈不亏下租售比既基准租售比 R_b = \frac{1}{C_p} ,租金倍数与租售比互为倒数,二者理想均衡状态下必将重合;
power((s_m_sale / s_m_rent) * (a_weighted_sale_ping / a_weighted_rent_ping),1.0/3.0) as const_ping, -- 租金倍数
1 / power((s_m_sale / s_m_rent) * (a_weighted_sale_ping / a_weighted_rent_ping),1.0/3.0) as base_ratio,
租金倍数与加权平均租售比之倒数二者月走势,剔除2020年2月数据,2022年疫情反复及2023年二者整体下行,说明消费和租金有所下行,是不好的趋势。购物中心的运营会随时间和经验的积累趋于成熟而租售均衡,也就是租售贡献率及租金倍数与租售比倒数的走势重合,以十年为尺度,这一过程对应运营人员是可观察的。


租金倍数表示特定城市特定购物中心在不同经济时期的商业价值,坪效的意义本身就是反映商业价值,是销售和租金比值关系,是一个整体性累计指标,表示租售匹配与离散的关系。租售比随着经济发展呈现持续缓慢下降的趋势,租金倍数呈现缓慢上升趋势,二者最终维持在合理区间里,终究会均衡。长期看租金只可能维持在合理水平,销售因为收入增长人口生活品质的内在要求带来的消费和需求的增长而增长。加权租售比反映租售比的离散差异,基准租售比反映购物中心在当地经济环境下收入和消费水平决定的基准扣点。可在整体、月度、年度时间层面,业态、计租方式、商户层面分类租金倍数,租金倍数的倒数就是基准租售比,也称为租金扣点。
不同城市购物中心因收入消费水平的各异租金倍数不一样,比如新城控股旗下遍布全国各地的一两百个吾悦广场,其租赁数据在租金倍数分布上更具有启发性。
引入月度盈亏平衡点和租金倍数的散点图,剔除购物中心早期2个月和2020年2月异常点位分布,二者具有高拟合度 R^2 = 0.8571,高spearman等级相关性0.926,回归方程 y = 0.0096 \times x - 0.0346,租金倍数能解释盈亏平衡点 。图表又一次呈现疫情的反复对线下以购物中心为主要消费形式实体经济面临的显而易见的冲击。


例如某业态租售比在0.2上下,疫情打破租售比持续下降的趋势。坪效租售比在0.1 - 0.15之间。


租金倍数的参考价值
在招商过程当中采取哪一类计租方式,参考基准租售比确定租赁合同租金扣率。或以固定租金乘以相似商铺的租金倍数确定商户保底销售额,评估租户的销售额是否能达标。或评估纯扣点租金的扣率是否过低。或保底+提成计租方式达成合理的保底租金+浮点租金。或参照相似商铺基准租售比上浮或下调租售比。或参照业态计租方式的基准租售比确定相同业态收计租方式的租户扣点。
[5] 贡献率和租金倍数SQL
字段计算,属性分组,多层次分类,多重嵌套查询,可挖掘租赁模式、购物中心赚钱指数等信息。模式匹配的假设是过往经验可以复制和延续,模式挖掘思路大体1层分类(业态、楼层、计租方式)下匹配最赚钱和最亏钱的模式;2级分类(业态+楼层、业态+计租方式、楼层+计租方式)下匹配最赚钱和最亏钱的模式;3级分类(业态+楼层+计租方式)下匹配最赚钱和最亏钱的模式;
结论就是得到什么业态在什么楼层的铺面配置什么计租方式下的赚钱或亏钱模式,数据背后是拿真金白银开店的商户商业实践,一大部分是试错亏钱的商户。任何模式都是环境当中的产物,经历过疫情反复,不能过度迷信以往模式和经验而遗忘疫情的系统性冲击和经济个体深处其中的努力和挣扎。
不同城市、同一城市不同购物中心商业价值培育程度各异,赚钱指数各有不同。在缺乏数据下的直观感受,上海的坪效肯定高于昆明的坪效;同为昆明北市区购物中心,同德广场的坪效可能高于欣都龙城的坪效。有数据,掌握分析方法,你才能理解繁华商业背后的门道。
不公开生成ping表的租售贡献率代码,读者自行编写。如若将计算贡献率代码引人进来,代码结构多层嵌套会变得尤其复杂,难于理解和使用。计算贡献率的分类分组与贡献率的分类分组的应用具有一致性的考虑,谁有更好的计算贡献率的思路?加权贡献率是以整体MALL销售为除数或是分类汇总的销售为除数,即以什么定义贡献率最小粒度。
-- ----------------------------------------
-- 加权坪效算法
-- 多重分类销售和租金坪效和贡献率
-- 必须由sale表生成ping表,租售贡献率是核心数据
-- 以何种分类就展示何种信息
-- ----------------------------------------
select
	-- year as '年份',
	month as '月份',
	-- shop as '商户',
	-- shopid,
	-- indy as '业态',
	-- floorid as '楼层',
	-- rent_type as '收租方式',
	-- contract_period as '合同周期',
	-- position as '铺位',
	-- if(shop not in (select distinct shop from park.ping where month = 202208) and shop != 'H&M','否','是') as '在租',
	-- cnt as '[商户或月]数',
	-- shop_pro as '[商户或月]占比',
	-- 大于0.7有退租可能
	-- loss_quit as '亏损数',
	-- loss_quit_rate as '[商户或月数]亏损占比',
	-- cnt_cp as '合同周期数',
	-- sale_million100 / 100000000 as '销售[亿]',
	-- rent_million100 / 100000000 as '租金[亿]',
	-- 两个固定租金
	-- category_weighted_fixed / 10000 as '加权固定租金[万]',
	-- if(m_fixed > 0,m_fixed / 10000,null) as '固定租金[万]',
	-- category_weighted_rent / 10000 as '加权租金[万]',
	-- point = floating / sale
	-- 分组混乱,无实际意义
	-- point as '提成率',
	-- weighted_fixed as '基准固定租金',
	-- weighted_fixed / point as '基准销售',
	--
	-- (1 / point) / power((sale_million100 / rent_million100) * (category_weighted_sale_ping / category_weighted_rent_ping),1.0/3.0) as '提成租金与租金倍数比值',
	-- category_weighted_sale_ping * area as '加权坪效对应的销售',
	-- 坪效
	-- category_weighted_sale_ping as '销售坪效',
	-- category_weighted_rent_ping as '租金坪效',
	-- sale_pro as '销售占比',
	-- rent_pro as '租金占比',
	-- dc_rent_type as '计租类型变更数',
	-- turnover_rate as '换手次数',
	-- 赚钱能力和贡献率为一组
	-- sale_contribution_ratio - rent_contribution_ratio * category_weighted_ratio as '赚钱能力', -- as break_even_point
	sale_contribution_ratio as '销售贡献率',
	rent_contribution_ratio as '租金贡献率',
	-- 3个租售比为一组
	-- 1 / power((sale_million100 / rent_million100) * (category_weighted_sale_ping / category_weighted_rent_ping),1.0/3.0) as '基准租售比', --  base_ratio,
	-- if(category_weighted_ratio < 1,category_weighted_ratio,null) as '租售比',
	-- if(ping_ratio < 1,ping_ratio,null) as '坪效租售比',
	if(category_weighted_ratio < 1,1 / category_weighted_ratio,null) as '租售比的倒数',
	power((sale_million100 / rent_million100) * (category_weighted_sale_ping / category_weighted_rent_ping),1.0/3.0) as '租金倍数'
	-- round((sale_contribution_ratio - rent_contribution_ratio * category_weighted_ratio) * 10000) as '赚钱指数' -- as money_index
from
(
	select year,month,indy,floorid,rent_type,contract_period,point,fixed,shopid,shop,position,area,
		sum(sale) as sale_million100,
		sum(rent) as rent_million100,
		max(fixed) as m_fixed,
		-- 按扣点分组固定租金,分组混乱,无实际意义
		sum(fixed * (shop_cnt / whole_shop_cnt)) as weighted_fixed,
		count(*) as cnt,
		count(distinct contract_period) as cnt_cp,
		-- 销售贡献率 - 租金贡献率 * 租售比小于0为退租充分条件
		count(if(break_even_point < 0,1,null)) as loss_quit, -- as '亏损数',
		-- 大于0.7有退租可能为必要条件
		count(if(break_even_point < 0,1,null)) / count(*) as loss_quit_rate,
		count(distinct rent_type) as dc_rent_type,
		count(distinct shop) as turnover_rate,
		count(*)  / whole_shop_cnt as shop_pro,
		sum(sale) / whole_sale as sale_pro,
		sum(rent) / whole_rent as rent_pro,
		sum((sale / area) * (sale / s_sale)) as category_weighted_sale_ping,
		sum(fixed * (fixed / s_fixed)) as category_weighted_fixed,
		sum(rent * (rent / s_rent)) as category_weighted_rent,
		sum((rent / area) * (rent / s_rent)) as category_weighted_rent_ping,
		sum(weighted_sale_contribution_ratio / whole_weighted_sale_contribution_ratio)  as sale_contribution_ratio,
		sum(weighted_rent_contribution_ratio / whole_weighted_rent_contribution_ratio)  as rent_contribution_ratio,
		sum((rent / area) * (rent / s_rent)) / sum((sale / area) * (sale / s_sale)) as ping_ratio,
		sum(if((rent / sale) < 1,(rent / sale) * (rent / s_rent),0)) as category_weighted_ratio
	from
	(
		select s.*,s_sale,s_fixed,s_rent,whole_shop_cnt,shop_cnt,whole_sale,whole_rent,whole_weighted_sale_contribution_ratio,whole_weighted_rent_contribution_ratio
		from
		(
			(
				select *,
					weighted_sale_contribution_ratio - (rent / sale) * weighted_rent_contribution_ratio as break_even_point,
					if(floating > 0,floating / sale,null) as point, -- 扣点
					if(fixed > 0 and floating > 0,floating / fixed,null) as ff_ratio -- 浮固比
				from park.ping
				order by month
			) as s,
			(
				select category_group_left_table.*,
					whole_shop_cnt,
					whole_sale,
					whole_rent,
					whole_weighted_sale_contribution_ratio,
					whole_weighted_rent_contribution_ratio
				from
				(
					(
						select year as y,month as m,indy as dy,floorid as fid,rent_type as rt,contract_period as cp,position as p,shop as sp,
							sum(sale) as s_sale,
							sum(fixed) as s_fixed,
							sum(rent) as s_rent,
							count(*) as shop_cnt
						from park.ping
						-- group by year
						-- group by year,indy
						-- group by year,floorid
						-- group by year,rent_type
						-- group by year,rent_type,shop
						-- group by year,indy,rent_type
						-- group by year,shop
						-- group by year,shop,contract_period
						group by month
						-- group by month,indy
						-- group by month,indy,rent_type
						-- group by month,floorid
						-- group by month,rent_type
						-- group by month,rent_type,shopid
						-- group by indy
						-- group by indy,floorid
						-- group by floorid
						-- group by rent_type
						-- group by position
						-- group by indy,rent_type
						-- group by floorid,rent_type
						-- group by indy,floorid,rent_type
						-- group by rent_type,shopid
						-- group by indy,rent_type,position
						-- group by indy,floorid,shop
						-- group by shop
						-- group by shop,contract_period
					) as category_group_left_table, -- 左表
					(
						select year as yy,month as mm,indy as ddy,floorid as ffid,rent_type as rrt,contract_period as ccp,position as pp,shop as ssp,
							count(*)  as whole_shop_cnt,
							sum(sale) as whole_sale,
							sum(rent) as whole_rent,
							sum(weighted_sale_contribution_ratio) as whole_weighted_sale_contribution_ratio,
							sum(weighted_rent_contribution_ratio) as whole_weighted_rent_contribution_ratio
						from park.ping
						-- 较左表少1层分类
						-- group by year
						-- group by year,indy
						-- group by year,floorid
						-- group by year,rent_type
						-- group by year,shop
						-- group by month
						-- group by month,indy
						-- group by month,floorid
						-- group by month,rent_type
						-- group by indy
						-- group by shop
						-- group by floorid
						-- group by indy,floorid
						-- group by rent_type
						-- group by indy,floorid,rent_type
						-- group by indy,rent_type
					) as category_group_right_table -- 右表
				)
				-- where y = yy
				-- where y = yy and dy = ddy
				-- where y = yy and fid = ffid
				-- where y = yy and rt = rrt
				-- where y = yy and sp = ssp
				-- where m = mm
				-- where sp = ssp
				-- where m = mm and dy = ddy
				-- where m = mm and fid = ffid
				-- where m = mm and rt = rrt
				-- where dy = ddy
				-- where fid = ffid
				-- where rt = rrt
				-- where dy = ddy and fid = ffid
				-- where dy = ddy and fid = ffid and rt = rrt
				-- where dy = ddy and rt = rrt
			)as category_group_table  -- 合并的表
		)
		-- where year = y
		-- where year = y and indy = dy
		-- where year = y and indy = dy and rent_type = rt
		-- where year = y and floorid = fid
		-- where year = y and rent_type = rt
		-- where year = y and rent_type = rt and shop = sp
		-- where year = y and shop = sp
		where month = m
		-- where shop = sp
		-- where shop = sp and contract_period = cp
		-- where month = m and indy = dy
		-- where month = m and indy = dy and rent_type = rt
		-- where month = m and floorid = fid
		-- where month = m and rent_type = rt
		-- where month = m and rent_type = rt and shopid = id
		-- where indy = dy
		-- where floorid = fid
		-- where rent_type = rt
		-- where rent_type = rt and shop = sp
		-- where position = p
		-- where indy = dy and floorid = fid
		-- where indy = dy and rent_type = rt
		-- where floorid = fid and rent_type = rt
		-- where indy = dy and floorid = fid and rent_type = rt
		-- where indy = dy and rent_type = rt and `position` = p
		-- where indy = dy and floorid = fid and shopid = id
	)as outer_category_group_table
	-- group by year
	group by month
	-- group by indy
	-- group by floorid
	-- group by rent_type
	-- group by position
	-- group by shop
	-- group by shop,contract_period
	-- group by year,shop
	-- group by year,indy
	-- group by year,indy,rent_type
	-- group by year,indy,shopid
	-- group by year,floorid
	-- group by year,floorid,rent_type
	-- group by year,rent_type
	-- group by year,rent_type,shopid
	-- group by month,indy
	-- group by month,indy,rent_type
	-- group by month,floorid
	-- group by month,floorid,rent_type
	-- group by month,rent_type
	-- group by month,rent_type,shopid
	-- group by indy,floorid
	-- group by indy,floorid,shopid
	-- group by indy,rent_type
	-- group by floorid,rent_type
	-- group by indy,floorid,rent_type
	-- group by indy,rent_type,position
	-- group by rent_type,shopid
	-- group by indy,floorid,shopid
	-- group by indy,floorid,rent_type,shopid
)as whole_combination_table
-- where rent_type = '提成比保底高'
-- where indy = 'CY' and rent_type = '提成比保底高'
-- where shop in (select distinct shop from park.sale where month = (select max(month) from vcpark.sale)) or shop = 'H&M'
-- where category_weighted_ratio <= 1 -- and sale_contribution_ratio - rent_contribution_ratio * category_weighted_ratio <= 0.1
-- where shop like '%咖啡%' or shop like '%星巴克%' -- indy = 'CY'  -- loss_quit_rate >= 0.7 -- and indy = 'FW' -- and -- floorid = 0 and  -- position like '%3-011/012%' -- shopid = '0348' or shopid = '0356' indy = 'LS'
-- where rent_type = '纯扣点'
-- where indy = 'FW'
-- order by year;
order by month;
-- order by indy;
-- order by floorid;
-- order by rent_type;
-- order by const_ping desc;
-- order by loss_quit_rate desc;
-- order by turnover_rate desc;
-- order by money_index desc;
-- order by year,money_index desc;
-- order by indy,rent_type,year;
-- order by year,indy,money_index desc;
-- order by shop,year;
-- order by year,floorid,rent_type;
-- order by year,rent_type;
-- order by year,rent_type,money_index desc;
-- order by year,money_index desc;
-- order by indy,year;
-- order by indy,month;
-- order by rent_type,indy,month;
-- order by indy,rent_type,month;
-- order by month,floorid;
-- order by month,floorid,rent_type;
-- order by rent_type,month;
-- order by shop,contract_period;
-- order by rent_type,category_weighted_ratio desc;
-- order by rent_type,month;
-- order by indy,floorid;
-- order by indy,floorid,money_index desc;
-- order by indy,rent_type;
-- order by floorid,rent_type;
-- order by indy,floorid,rent_type;
-- order by rent_type,money_index desc;
-- order by money_index desc,indy,rent_type;
-- order by indy,floorid,rent_type,money_index desc;
-- order by position,indy,rent_type;
数据结果引入到可视化工具呈现形态和分布,作为铺面配置决策的指导思路。
[6]退租SQL
以盈亏平衡点阈值0衡量租户赚钱和亏钱,可检验商户销售的真实性,针对那些表面长期亏钱依然不退租的商户采取运营措施优化商业坪效和价值,以及预测哪些商户可能会退租,做好招商预案。
-- ---------------
-- 退租算法
-- 评估商户活力
-- 亦能评估久租不退的商户销售呈报之销售的可信性
-- ---------------
select
	-- month,
	shop,
	not_off as '在租',
	concat_ws('->',min(month),max(month)) as '租期',
	count(distinct contract_period) as '合同周期数',
	sum(sale) / 10000 as '销售[万]',
	sum(rent) / 10000 as '租金[万]',
	rent_type as '计租方式',
	-- count(distinct rent_type) as '计租类型数',
	count(month) as '租赁月数',
	-- 销售贡献率 - 租金贡献率 * 租售比小于0为退租判断条件
	count(if(BEP_index < 0,1,null)) as '亏损数',
	-- 大于0.7有退租可能
	count(if(BEP_index < 0,1,null)) / count(month) as lost_rate, -- as '亏损数占比',
	sum(BEP_index) as money_index
from
(
	select *,
		-- (销售贡献率 - 租金贡献率 * 租售比) * 基数
		(weighted_sale_contribution_ratio - weighted_rent_contribution_ratio * (rent / sale)) * 1000 as BEP_index,
		if(shopid not in (select distinct shopid from park.sale where month = (select max(month) from park.sale) and shop != 'H&M'),'否','是') as not_off
	from park.ping
	-- where month = 202208 -- indy = 'CY' and rent_type = '纯扣点' -- and shop like '%%'
	order by shop,month
)as s
-- where not_off = '是'
group by shopid
-- group by month
-- group by rent_type
-- order by money_index desc,shop;
order by lost_rate desc,money_index;
-- order by month;
-- order by money_index desc;
[8]散点图
常用的标准化z-score,产生和值及均值为0,标准差为1的一组数据。STZ = \frac{d_i - \frac{1}{n}\times\sum_{i=1}^{n}d_i}{\sqrt{\sum_{i=1}^{n}{\frac{({d_{i}-\bar{d}})^2}{n - 1}}}} ;
对月分类的租售贡献率做标准化后的回归分析
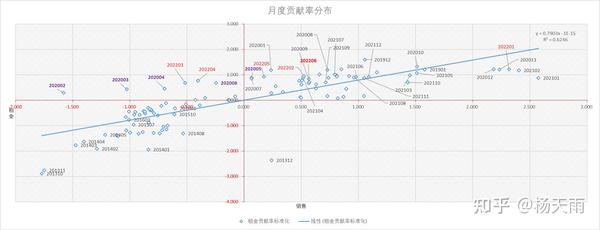

未标准化的贡献率分布,图标颗粒大小代表销售贡献率大小。检验贡献率算法的有效性


[9]层次聚类分析
引入贡献率数据到数据挖掘软件,得到基于贡献率距离矩阵的月聚类,比如疫情爆发月份、疫情反复月份为一个类,购物中心不同运营时期划分为不同的聚类。


层次聚类,聚类技术可用于广泛的数据场景,用于发现欧式距离相似的月份。例子引入销售贡献率和租金贡献率2个变量聚类,分得18个聚类。


引入租售贡献率和赚钱指数,缩小到10个聚类。如疫情爆发和疫情的反复月份及经济恢复月份归类为同一个类,2020年2月影响程度大于3月,3月大于4月,2022年3月影响程度大于4月冲击力不如2020年2月3月和4月。mall在不同运营时期以2018年前后划分为不同的聚类。2022年6月同2018月11月和2019年9月相似,但表现比这两个月差。


[10]关联规则挖掘
频繁模式和关联规则都不适合商业租赁数据挖掘。如果在mall当中某种模式频繁出现,比如某类业态在某个楼层以某种计租方式长期存在,只能说明楼层的业态结构稳定,或者说某类店在mall当中在某个楼层以某种租金模式长期经营,不代表其他含义。频繁出现的租赁模式是平庸无差异缺乏无弹性的。
大体了解挖掘算法前驱和后继的支持度和置信度,可用市面上的数据挖掘软件。比如服务业以固定租金模式频繁出现,只能说明服务业某几个商户在mall的某个楼层里长期经营,没有太大变化。


[11]使用投资组合理论模拟配置最优业态和计租方式
摸索套用现代投资组合理论框架引入月盈亏平衡或者月租金贡献率到业态和计租方式分类的方差协方差矩阵,得到的配置比例基于均值方差效用最优,这种最优就是哪类业态+计租方式的均值和稳定性最优配比,组合当中比例高的模式就是均值和稳定性最优的模式,而负比例模式表示效用最差模式,缺乏可操作性。


如果按投资思维,超配业绩好且稳定的模式,“做空”业绩差不稳定的模式。在现实mall运营里,你根本无法实现投资世界里的资产配置,招商过程时间长过程复杂,商户退租要依照租赁合同执行,不能以铺面未达到最优配置而主动触发铺面换手。mall的铺位配置思路和投资配置不一样,仅当参考。
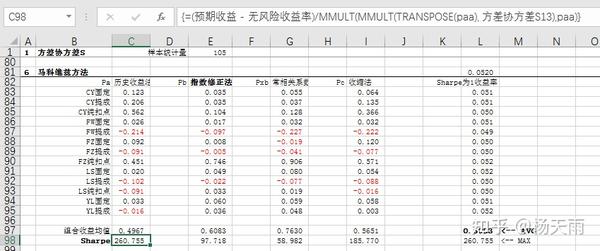

即便在投资当中使用马科维茨的均值方差方法,以历史收益率为基础的方差协方差矩阵是历史走势堆砌出来的缺乏前瞻性灵活性方差协方差矩阵,实质上没什么用处,仅在数学上有用。组合的包络线围绕各资产风险和收益(标准差和均值),貌似科学完美,实际上没用,因为数据是历史数据不能表示预期。


mall铺位资源配置有没有最优模式,就像官媒常说的“求最大公约数,画最大同心圆”,是目标理想,也是孜孜以求。
[12]盈亏平衡点&租售比分布
选取计租方式分类的月租售比和盈亏平衡点散点图分布,得4类分布。观察回归方程,盈亏平衡点与租售比低拟合,铺面租金不能解释商户亏损,应当销售业绩下滑归因,而最终租金确实是压死商户的最后一根稻草。


商场出于管理成本考虑,多数未统一收银,由商户自行呈报销售业绩,固定租金收租商户有动机填报有保留的销售业绩,会造成铺面坪效长期失真,租金定价不合理,比如退租算法得出的长期亏钱却还在经营的商户。如何合理定价固定租金,以及如何描述固定租金和销售业绩的关系,下一节租金倍数有描述。商户倾向于在租约早期填报真实的销售,随着租金递增,倾向于填报虚假销售推高租售比,造成表面上的亏钱现象。


保底+提成销售业绩下滑时候的分布与固定租金分布相似,不同之处在租售比的起点。


保底+提成租金在销售业绩好的时候,此类租金方式是纯扣点租金的变体,二者线性回归线是平行线。商户盈亏平衡点函数是垂直线,x = 纯扣点或者租售比,这种租金模式对商户最有利,其变体对商场有利。


[13]盈亏平衡点&租金倍数分布
4类计租方式盈亏平衡点呈现不同的高度不同的分布,高度表示商户的赚钱效应,横向表示经营产生的商业价值(剔除了早期月份和2020年二三月异常点位)。固定最高,纯扣点次之,保底+提成销售业绩好的时候第3高,保底+提成在消费收缩的时候位置最低且最靠左商业价值最低。大致可以看出,固定计租方式租金明显定价过低,由头部品牌拉升,租金水平与销售严重偏不匹配,大概在招租定合同的时候错误预估商户的预期销售业绩,或着眼于大品牌的人气带动价值或看好大品牌持续稳定的经营能力能带来稳定的租金收入而在租金上让利,以及未采取动态的计租方式,比如销售额超设定的阈值后固定租金上一个台阶。大品牌在购物中心定租博弈当中比中小品牌以及个体工商户更有话语权和租金定价权。


租金倍数在固定租金分布上有拟合度0.7887和相关性0.888,租金倍数能解释盈亏平衡点,可以用租金倍数预测固定租金对应的保底销售额(固定租金*租金倍数数就是保底销售额),鉴于固定租金基准租售比低实际租售比,租金倍数比较离散,在具体操作层面取相似业态相似销售规模商户的租金倍数,可用同一聚类商户租金倍数。保底+提成计租方式在消费收缩的时候无赚钱效应,被动支付保底租金。


扣点租金盈亏平衡点呈现垂直分布,租金倍数分布在小范围内,与租售比扣点被锁定有关,赚钱效应显著,租金倍数的解释力不足。


[14]坪效租售比&基准租售比&权重租售比
疫情口罩限流推高租售比,逆转租售比缓慢下降的趋势,宏观因素扰动促成租售比的高波动性,暗示商业需要稳定的经营环境。月坪效租售比始终在租售比的下方,坪效租售比波动小,体现一个mall的坪效租售比水平。


四类计租方式下的租售比,从左至右、由高到低分别是保底比提成高、固定、提成比保底高、纯扣点对应的租售比分布。固定租金坪效租售比最低,意味着产生最低的租金坪效。保底租金坪效租售比最高,在销售业绩下滑之时能保住租金坪效。从租售比与坪效租售比的离散程度看,保底比提成高、固定偏离度高,波动性大,而提成比保底高、纯扣点重合度高,波动小。


回归本源,单纯看销售和租金的关系,广泛共识销售决定租金,纯扣点租金关系就是以相对固定的扣点乘以销售锚定租金的线性关系,相关性为1,回归方程斜率就是租售比,截距为0。而固定租金表现出与销售无关,二者相关性为0,回归线几乎是水平线,或许是销售不真实或固定租金定价方式不能与动态的反映销售的变化,整体低坪效,租售比失真,维持着出租状态保持必要的出租率带来固定且稳定的租金现金流,在大多数购物中心当中普遍存在这样的情况。


[15]租金坪效&销售的关系
有租金定价权的大品牌通常采用纯扣点计租方式,销售业绩决定租金坪效。采取固定租金方式租金与销售无关,租金坪效一样与销售无关,是一条水平线。保底和提成收租取高方式,是看涨期权模式,销售低于某个阈值收取保底租金(实质固定租金),销售超过某个阈值取扣点租金,其扣率往往高于纯扣点,高斜率高倾角。如图,其中b为租售比,C为固定租金,s为销售,a为租赁面积。


商户月销售租金数据。大体上实际分布就如手绘图一样。固定租金模式租金坪效与销售无关,是水平线。取高模式是看涨期权,续签合同动态调整扣率,一旦固定了保底销售,租金坪效范围会被放大,是平行线向上延伸高倾角斜线。纯扣点模式租金坪效和销售完全线性相关,纯扣点二是复杂的纯扣点模式,在整年销售达到阈值后取更高的扣点,出现“分叉”。
租金坪效大小反映一城一片区一个商业购物中心的租金水平和商业价值,是市场定价的结果。品牌效应不会在数据上体现,是来撑场面的商圈共荣效应。


看涨期权计租方式下的节选3个合同周期租售散点图,趋势固定租金和扣点持续上涨,呈现显著的看涨期权走势。如拆分合同周期2,为一条平行线y=0.0062和一条扣点为0.09的斜线 y=0.09\times{x} ,斜线拟合优度为1。


[16]看涨期权计租方式下的基准销售
设销售 S ,固定租金 R_{c} ,扣点 p 为合同约定的租金扣点,浮点租金R_{f}=S\times{p} ,则触发扣点租金的阈值销售即基准销售 S_{c}=\frac{R_{c}}{p} ={R_{c}}\times{p}^{-1} , {p}^{-1} 就是租金倍数。在一个合同周期里,固定租金 R_{c}与扣点 p保持不变,基准销售亦是一条水平线,固定租金增大,基准销售上行;扣点增大,基准销售下行。基准销售预估商户的预期销售,评估固定租金、扣点、预期销售是否合理。


选取几个典型的看涨期权计租方式,多数月份获得扣点租金,观察销售与基准销售的走势,哪一个的固定租金与扣点的配置较为匹配,以及评估及预估看涨期权计租方式的匹配性。
-- --------------------------------
-- 看涨期权计租方式的基准销售
-- --------------------------------
select month,shop,
	contract_period as '合同周期',
	-- rent_type as '计租方式',
	if(floating > 0,floating / sale,null) as '扣点',
	if(fixed > 0 and floating > 0,floating / fixed,null) as '浮固比', -- 大于1获得提成租金
	if(fixed > 0,fixed / 10000,null) as '固定租金[万]',
	if(fixed > 0 and floating > 0,sale * fixed / floating / 10000,null) as '基准销售',
	sale / 10000 as '销售',
	rent / 10000 as '租金'
from park.ping
order by shop,month;


[17]看涨期权计祖方式正态分布
在看涨期权租售数据里,看某业态获得提成租金的分布情况:
-- --------------------------------
-- 看涨期权计租方式的基准销售
-- --------------------------------
select
	-- month,
	-- shop,
	-- contract_period as '合同周期',
	-- rent_type as '计租方式',
	indy as '业态',
	-- 两个租售比散点图为水平线
	-- if(fixed > 0,if(fixed / sale < 1,fixed / sale,null),null) as '固定租金租售比',
	-- 浮固比,大于1获得提成租金
	if(fixed > 0 and floating > 0,floating / fixed,null) as dff_ratio
	--
	-- if(fixed > 0,fixed / 10000,null) as '固定租金[万]',
	-- if(floating > 0,floating / sale,null) as point, -- 扣点
	-- sale / 10000 as '销售[万]',
	-- if(fixed > 0 and floating > 0,sale * fixed / floating / 10000,null) as base_sale, -- '基准销售[万]'
	-- rent / 10000 as '租金[万]'
from park.ping
-- where floating > 0
-- where fixed > 0
where fixed > 0 and floating > 0
-- where shop like '%洋葱%'
-- order by shop,month;
-- order by rent_type;
-- order by rent_type,month;
order by indy,dff_ratio;
-- order by indy,sale;
-- order by point;
-- order by r_ping;
浮固比出现的频数:
-- ----------------------------
-- 正态分布
-- ----------------------------
select
	-- year,
	-- month,
	-- shop,
	-- contract_period,
	-- rent_type,
	indy,
	-- 散点图得收租方式租售比
	-- sum(sale) as '销售[万]',
	-- sum(rent) as '租金[万]'
	-- round(point,2) as '扣点',
	-- round(s_ping) as '销售坪效',
	-- round(b_ping) as '基准销售坪效',
	-- round(r_ping) as '租金坪效',
	-- round(base_sale,2) as '基准销售[万]',
	-- round(sale,1) as '销售[万]',
	round(floating / fixed,1)  as dff_ratio,
	count(*) as '记录数'
from
(
	select year,month,shop,contract_period,rent_type,indy,
		sale / 10000 as sale,
		rent / 10000 as rent,
		sale / area as sale_ping,
		rent / area as rent_ping,
		if(fixed > 0,fixed / 10000,null) as fixed,
		if(floating > 0,floating / 10000,null) as floating,
		if(fixed > 0,if(fixed / sale < 1,fixed / sale,null),null) as fixed_rate,
		if(floating > 0,floating / sale,null) as point,
		sale / area as s_ping,
		rent / area as r_ping,
		if(fixed > 0 and floating > 0,sale * fixed / floating,null) / area as b_ping,
		if(fixed > 0 and floating > 0,sale * fixed / floating / 10000,null) as base_sale,
		if(fixed > 0 and floating > 0,floating / fixed,null) as ff_ratio
	from park.ping
	-- where fixed > 0
	where fixed > 0 and floating > 0
	-- where rent_type = '固定' -- or rent_type = '保底比提成高'
) as s
-- group by year
-- group by month
-- group by month,rent_type
-- group by indy,round(base_sale / 5)
-- group by indy,round(sale / 4)
group by indy,round(floating / fixed,1)
-- group by round(point,2)
-- group by month,round(point,2)
-- group by round(r_ping / 10)
-- group by shop,contract_period,fixed
-- having count(*) > 0
-- order by shop,contract_period;
-- order by year;
-- order by month;
-- order by rent_type,month;
-- order by point;
-- order by base_sale;
-- order by r_ping;
-- order by indy,base_sale;
order by indy,dff_ratio;
结合两者数据,画出正太分布曲线,获得提成租金(就是浮固比大于1)的月数较少。出现这类情况,无非或销售不及预期(因素有或宏观下行消费降级,或经营不当,或销售缺乏监管而失真),或固定租金过高,或固定租金“合理”而扣点过低。宏观消费环境是首要决定预期销售的因素。


[18]租金倍数业态趋势
业态租金倍数趋势代表业态的成长性,亦代表租售之间的匹配性。波动过大,说明租金与销售偏离度过大,应当调整租售结构。如图处于持续收缩的某两业态。


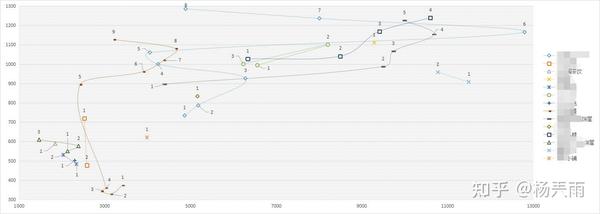
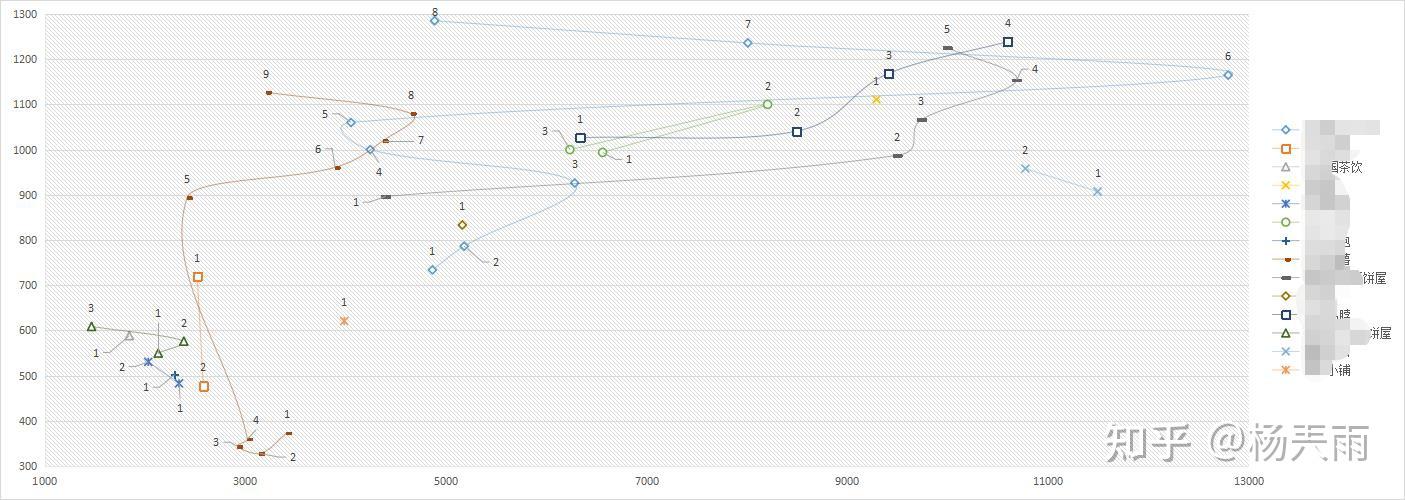
[19]合同周期坪效分布
商户在持续经营当中续租和调租,以固定租金及扣率相同的合同期为一个周期,一般12个月。每个合同周期的坪效加权算法,突出差异和波动性,非平庸的算术平均值,观察商户坪效在不同合同周期当中的变化。横轴是销售坪效,纵轴是租金坪效,标签为合同周期编号,最大编号为当前合同周期。如图多经点位坪效在合同周期当中的分布。
[20]简单粗暴的定租方式
比如某铺位面积100坪,经营某业态租金坪效200元/坪,业态租金倍数5.5,得保底销售 s = 200 \times 100 \times 5.5 = 11 万,租金2万,基准租售比0.182,商户销售业绩超过11万就能赚钱,实际租售比小于0.182,以此扩展具体的计租方式。
文章被以下专栏收录